Aplication 1
Application 1 is our first project designed for visualizing “measured” data. It is built on top of the MQTT protocol and is engineered to display environmental values inside a greenhouse. Instead of a physical device connected via MQTT, a simulator is included.
The greenhouse functionality is straightforward: the measured temperature (TEMP. MEASURED) is compared within the device against the desired temperature (TEMP. DESIRED). If the measured temperature falls below the desired threshold and heating is enabled (ENABLED), the heating output (HEATING) is activated.
The visualization includes a time-series chart that populates with values stored in the database upon initial load. The value range is currently hardcoded and can only be altered by modifying the configuration settings (not directly from the web interface).
Through this visualization, users can not only monitor these environmental values but also actively control the device — or in this case, the simulator — by adjusting the desired temperature and enabling the heating.

The application is built utilizing the following stack:
- Vue (frontend)
- Rust (backend)
- Mosquitto (MQTT Broker)
- SQLite (project configuration database)
- VictoriaMetrics (measurement database)
- Python (greenhouse simulation)
The visualization itself was built using the MeSca project.
You can check out the live application at:
https://app1.mevisys.net
Username: john@deer.com
Password: 1111
Currently, the project features a private admin menu used to configure the individual configuration tables, of which there are currently six. The schema is as follows:
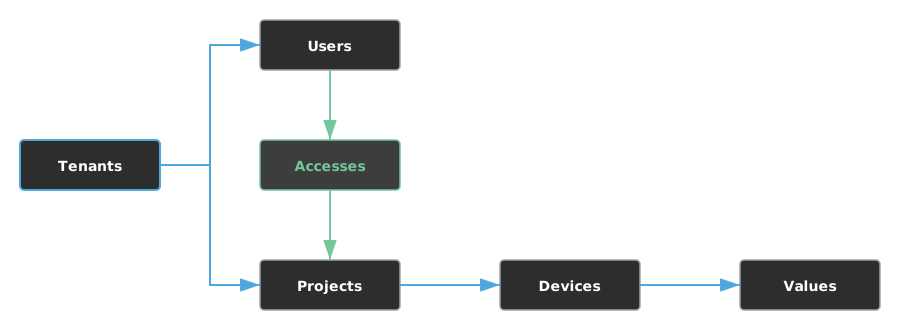
The system is designed to handle visualizations for multiple tenants. Each tenant manages their own list of users and projects. Access to individual projects is controlled via a mapping table, allowing the client to determine exactly which projects their users can access.
Data visualization is organized on a per-project basis. The visualization itself is not stored in the database, which is why it isn’t shown in the schema. Instead, it is managed as a collection of HTML files stored directly on the server’s disk, inside a directory dedicated to that specific project.
For data communication, each project is assigned one or more devices, and each device is mapped to a set of values. This logic dictates the construction of the value’s MQTT topic, where:
- the device configuration specifies the prefix
- the value configuration specifies the suffix
For example, if a device specifies the prefix “device1” and a temperature variable specifies the suffix “temp”, the complete MQTT topic used to publish the value to the MQTT broker will be “device1/temp”. This guarantees that the incoming value is correctly mapped to the project, making it available for visualization.
Main Admin Menu:

Tenant Management:

User Management:

Access Management:

Project Management:

Device Management:

Value Management:

For quick data inspection, a live values page is available.

This page displays critical metadata for each variable alongside its current reading. It also allows you to modify the values directly — once altered, the new value is not only pushed to the visualization and the database but is also published to the devices reading the data via the MQTT protocol.
Project 1 serves as a “proof of concept,” demonstrating that our selected tech stack is fully capable of driving a system designed not only for data acquisition and visualization but also for active device control.