Simple MQTT temperature sensor

In the previous post about monitoring temperature we have used a simple RS-485 connection to communicate with a sensor. While this approach is very simple and has been proven to work well in many applications it can be complicated when the amount of connected sensors increases. Also adding or removing sensors can cause complications.

Modern technologies allow us to connect sensors using existing computer networks. For example the incredible ESP32 SoC can easily be programmed to read data from a sensor and relay them over WiFi using MQTT protocol.

MQTT protocol is a publish-subscribe protocol that works over TCP/IP connections. One or more clients are connecting to a single broker and exchanging information with it. In the most simple case one client sends data to the broker – publishes in a given topic. Anyone who connects to this broker and subscribes to the topic gets notified when new data arrive.

This example uses the DHT22 temperature+humidity sensor and ESP-WROOM-32 development kit working as a client. The broker is a PC running Ubuntu 18.04. Both devices are connected to the same WiFi network.

First it’s necessary to install the Mosquitto broker.

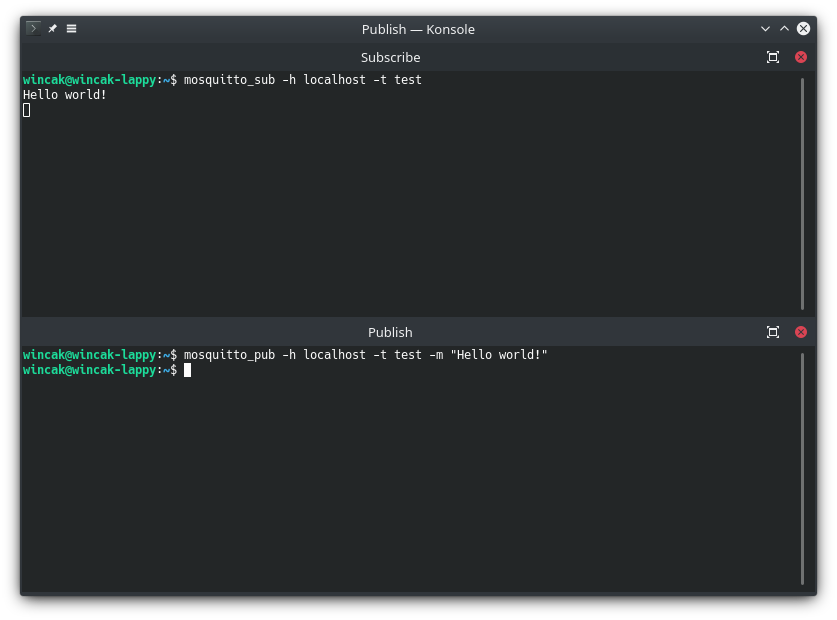
sudo apt install mosquitto mosquitto-clients

Now the broker should be installed, up and running. The default configuration does not use any encryption or password protection, which is fine for testing purposes. The functionality can be tested by subscribing to a topic and publishing a message to it.

Connecting the DHT22 sensor to ESP32 is simple. It can be powered from the 3.3V power supply. The sensor’s data output pin can be connected straight to one of ESP32’s digital inputs with approximately 4k7 kΩ pull-up resistor.

The ESP32 has to run a program that connects to WiFi, connects to the MQTT broker, reads new values from the sensor and periodically sends it over to the broker. This relatively complex functionality can be easily achieved using Arduino libraries. There is already a very good example on how to achieve this. Or you can use the final program used in this example.

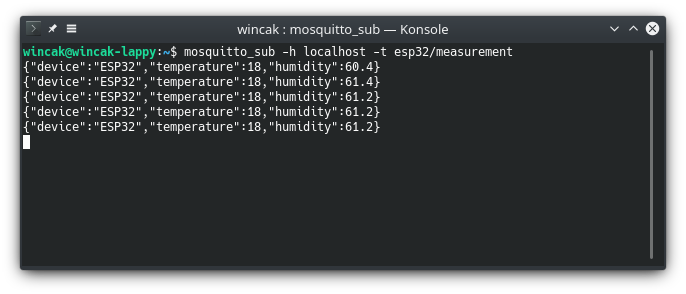
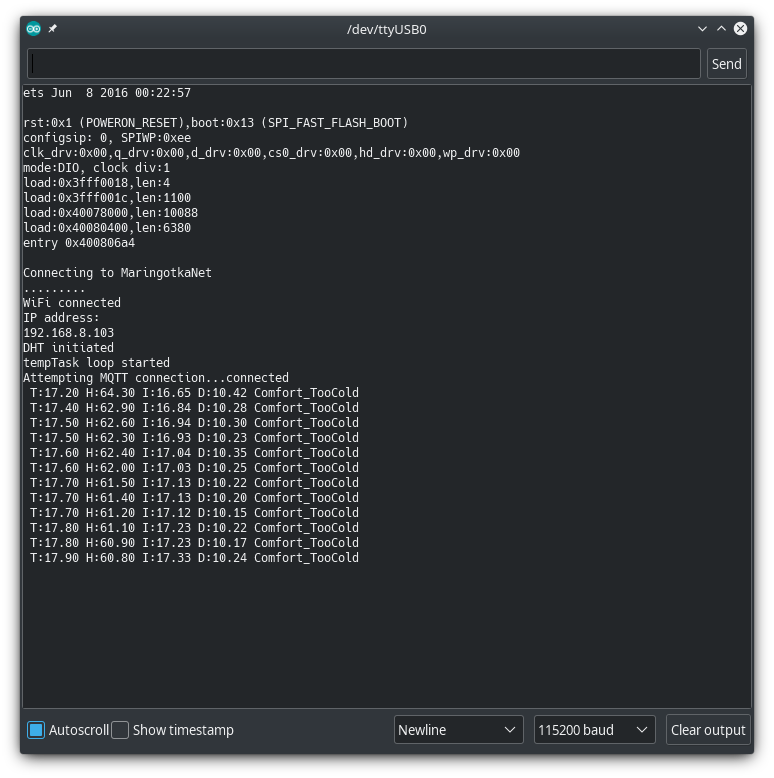
Now if everything goes as expected the ESP32 should boot up, connect to the broker and start sending measured values periodically.

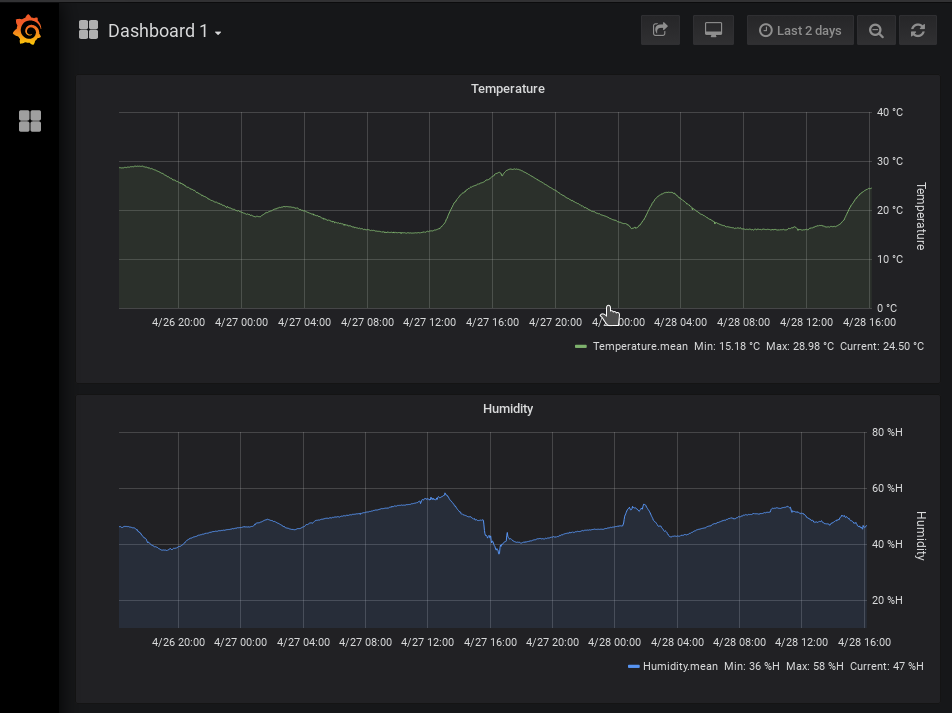
After subscribing to the topic the broker makes all new measurements available.

Environment monitoring using InfluxDB and Grafana

When we talk about environment monitoring, temperature monitoring is one of the most ubiquitous use-cases and makes for an illustrative example as well. The measurement side of the process is not an area that would offer many exciting innovations in this day and age – today it is all about how you process the collected data.

For this example we have used our CPU2 module based on the i.MX 6 platform. Using one of the available tools it’s possible to port Linux based operating system on it and deploy the necessary software environment (to be covered in future posts).

On the hardware side we have used the SHT11 temperature and humidity sensor. It communicates over RS-485 using the age proven MODBUS RTU protocol so it’s simple to connect to the CPU2 module. The module needs to be connected over the network to the server for measured data storage and evaluation.

There are several ways to interact with MODBUS devices from Linux OS. The traditional approach would be to create a C program using a modbus library. This allows you to work with minimum dependencies and overhead. Also you have a very tight control over the whole process. However when we use the rather powerful i.MX 6 processor we have the luxury of not having to count every processor cycle and kilobyte of memory. Much more pleasant way of achieving our goal is to use Python.

Using the “minimalmodbus” Python library we can simply open a text file, write a simple script using a text editor and feed it to the interpreter.

#!/usr/bin/env python
import math
import minimalmodbus
import sys
from time import sleep

TIME = 1
STATUS_MOD = 5

minimalmodbus.BAUDRATE = 9600

# port name, slave address (in decimal)
instrument = minimalmodbus.Instrument('/dev/ttyACM0', 1)

while True:
    # Register number, number of decimals, function code
    try:
        values = instrument.read_registers(1, 2, 4)
    except OSError as e:
        print("Read error")
        sleep(1)
    else:
        temperature = values[0] / 10
        humidity = values[1] / 10
        print("t:", temperature, "h:", humidity)

        sleep(60)

This simple program reads values from the sensor and prints them to the console. It’s simple to change parameters as necessary without recompiling anything.

Now we need to store the measured values. One of the solutions is to use a time-series database. These databases are optimized for storing continuous series of measured values. InfluxDB has proved to be a solid and reliable option.

For displaying values and evaluating them there are also ready-made solutions to choose from. The industry standard choice is Grafana. It is a web-based software that can display measured values as charts, gauges with many advanced options. On top of that it’s possible to use Grafana for basic measurement evaluation – to warn if values are exceeding specified limits and so on.

MEVISYS hosts both of these systems and allows developers to store their measured data and have them ready and available at all times.

Making some modifications to the script and using the “requests” and “json” libraries we can format the measured data accordingly and store them periodically in the database.

#!/usr/bin/env python
import json
import math
import minimalmodbus
import requests
import sys
from time import sleep

# InfluxDB
IP= "XXX.XXX.XXX.XXX"
PORT = "8086"
DB = "measurements"
USER = "username"
PASSWORD = "password"

TIME = 1
STATUS_MOD = 5

minimalmodbus.BAUDRATE = 9600

# port name, slave address (in decimal)
instrument = minimalmodbus.Instrument('/dev/ttyACM0', 1)

while True:
    # Register number, number of decimals, function code
    try:
        values = instrument.read_registers(1, 2, 4)
    except OSError as e:
        print("Read error")
        sleep(1)
    else:
        temperature = values[0] / 10
        humidity = values[1] / 10
        print("t:", temperature, "h:", humidity)
        m1 = 'temperature value=%s' % temperature

        r = requests.post("http://%s:%s/write?db=%s" %(IP, PORT, DB), auth=(USER, PASSWORD), data=m1)
        if r.status_code != 204:
            print ('Failed to add point to influxdb (%d) - aborting.' %r.status_code)

        m2 = 'humidity value=%s' % humidity
        r = requests.post("http://%s:%s/write?db=%s" %(IP, PORT, DB), auth=(USER, PASSWORD), data=m2)
        if r.status_code != 204:
            print ('Failed to add point to influxdb (%d) - aborting.' %r.status_code)

        sleep(60)

Now every measured value gets sent over the network and stored remotely. Using a graphical interface Grafana can be configured to display stored values from InfluxDB.